Drawing Air, 2025
Graphite on paper
75×115 cm
Thinking about the atmosphere and my relationship with it begins to define an infinitely complex subject matter, which is both visible and invisible all at once. I see the clouds, my breath in cold air, radar, satellite imagery and so on, yet the air which surrounds me is somewhat of a mystery. Perplexed by my relationship with the atmosphere, I seek to define it with the driving point of my pencil on a soft white cotton surface. The marks on paper begin to define my delicate relationship with this invisible can of worms. But how can one actually define something which simultaneously shares an amorphous state of matter with the objectively physical experience of life?
Early on, scientific research began to study the atmosphere as a measurable form of matter before technology allowed humans to leave the ground and explore its upper reach. In 1648, *Blaise Pascal and Florin Perier climbed to the top of the Puy de Dome, carrying with them a new scientific instrument invented by Italian scientist, Evangelista Toricelli. The instrument was a barometer, which allowed them to measure decreasing pressure with their assent. The measurements helped Pascal to develop his theory which proposed there was a vacuum which existed above the Earth’s atmosphere.
*UCAR Center for Science Education (2025). The History of Atmospheric Discovery. Available at: https://scied.ucar.edu/learning-zone/atmosphere/history-discovery-atmosphere (Accessed: 6 December 2025)
Today, ghostly floating images of the glowing plasma-like field surrounding the Earth are contrasted by the black vacuum of space. Yet, the iconic visuals we know from orbit are no more defining of the atmosphere’s physical matter or substance. The concept of gas as a form of matter still visually perplexes me. *Gas comes from the Greek word khaos, or “empty space”, and it was coined by the Flemish chemist, Jan Baptist van Helmont in the 17th century. It’s widely held that Helmont learned the term from Paracelsus, a Swiss alchemist, who used the Greek to describe the “proper elements of spirits”.
*Etymonline (2025). Origin and history of gas. Available at: https://www.etymonline.com/word/gas (Accessed: 6 December 2025)
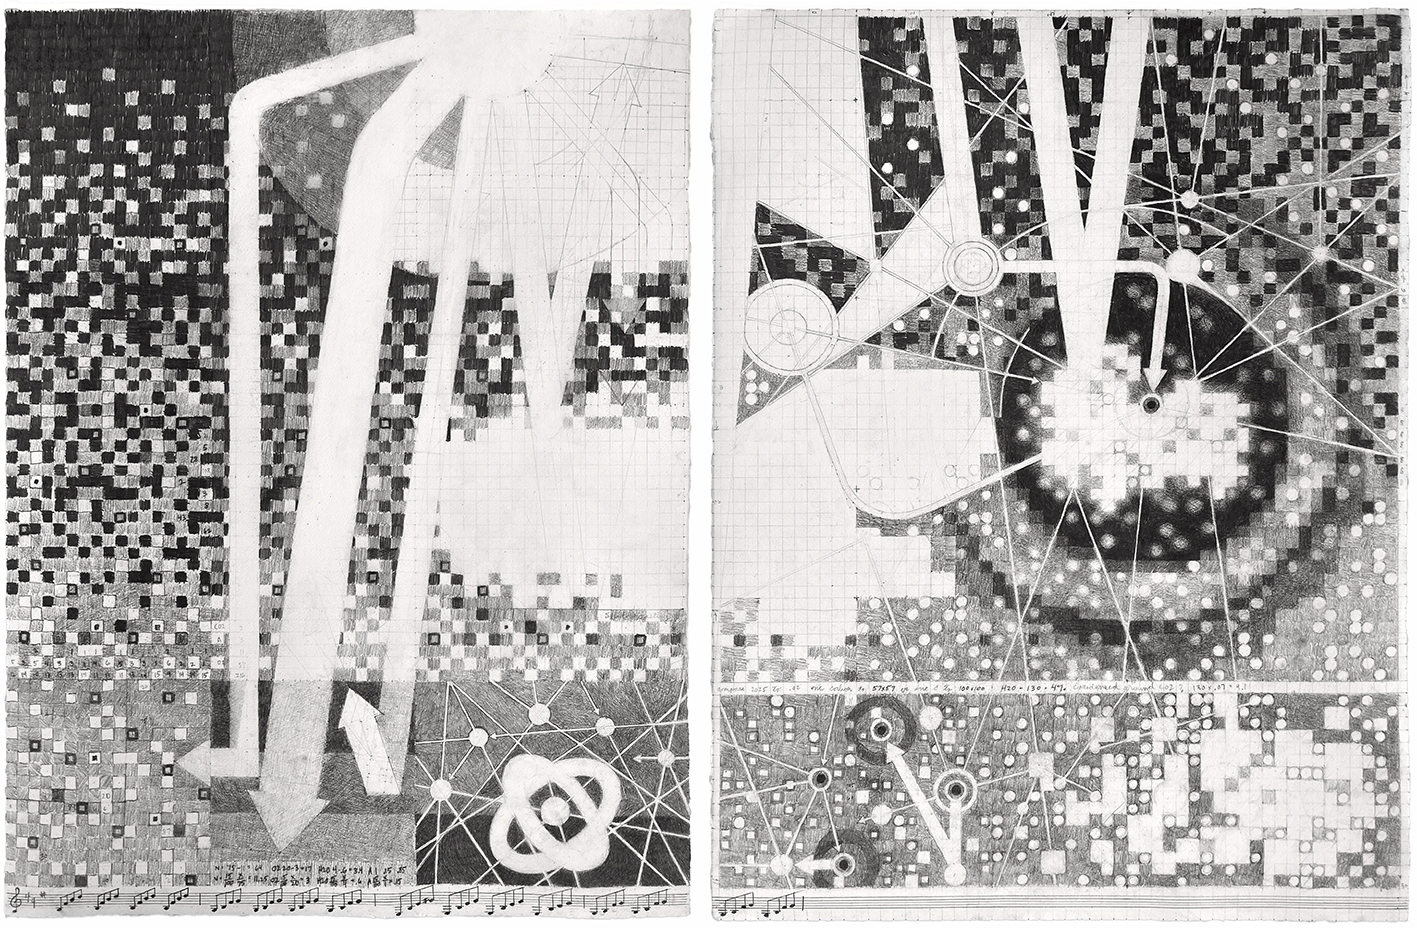
Fast forward, a new shrink-wrapped sketch book is opened, and a simple 10×10 cm grid is drawn to define these elements. It is a collection of particles which can be expressed through percentages, hence a 10×10 grid.
1. Nitrogen-74.96%
2. Oxygen-20.11%
3. Water-04.00%
4. Argon-00.89%
5. Carbon Dioxide-00.04%
National Oceanic and Atmospheric Administration (2024). The Atmosphere. Available at: https://www.noaa.gov/jetstream/atmosphere
(Accessed: 16 November 2025)
A pattern, which randomly begins to emerge, starts by assigning each cell with a designated particle. Seventy five cells are marked with Nitrogen, then twenty for Oxygen and so on, until the grid is filled. Ironically, since the concentration of CO2 is < 1% it presents a problem for the 10×10 grid, as it does for the atmosphere, but in a completely different way. In order to accurately represent its relationship to the other particles, a much larger sheet of paper is required.
Although, the atmosphere is obviously more than a random collection of particles. It’s a complex system of energy in constant flux. It’s influenced by radiation from the sun, water vapor, plants, forests, temperature variations, latitude, longitude, the tilt of Earth’s axis in relation to solar orbit, among an endless multitude of dynamic relationships which defines our existence.
And there is a much deeper irony which exists if one takes into account the scale of such a drawing that would be required to represent carbon dioxide in terms of parts per million. How does this particle, which accounts for such a small percentage of the atmosphere, have such a profound impact on Earth’s regulatory systems? What are the mechanisms behind its powerful force? Is it atomic, molecular, or perhaps something else?
As the Earth receives energy from the sun, approximately *23% of it is absorbed by the atmosphere, *48% is absorbed by the surface and *29% is reflected back into space. In my drawing, the width of the body of an arrow corresponds to the amount of solar radiation which is absorbed or reflected. A 23mm wide body represents atmospheric absorption, 48mm represents absorption by the surface, and 29mm is reflection. The percentages play an important role in a process known as radiative cooling, which is part of the reason why small quantities of CO2 have such a powerful effect.
The majority of gas in the atmosphere, Nitrogen and Oxygen, do not absorb solar radiation, but carbon atoms present in CO2, and water vapor do. As they absorb radiation, it charges the particles, like a battery, by increasing their level of atomic vibration. As the sun shines, the particles become increasingly exited by vibrating faster and faster until the planet’s rotation moves them away from the sun into the fall of night. Then, as the particles lose their energy by emitting thermal or infrared radiation, their rate of vibration begins to slow down which is basically how radiative cooling works. The problem is with the rate at which the particles cool. Before the industrial revolution, when there was half the amount of CO2 as today, a balance existed between the incoming radiation and the particles in the atmosphere. The rate of particle cooling, in combination with surface absorption and reflection, was in a harmonic state of equilibrium.
*Rebecca Lindsey (2009). Climate and Earth’s Energy Budget.
Available at: https://earthobservatory.nasa.gov/features/EnergyBalance
(Accessed: 16 November 2025)
NASA Science Editorial Team (2022). Steamy Relationships: How Atmospheric Water Vapor Amplifies Earth’s Greenhouse Effect. Available at: https://science.nasa.gov/earth/climate-change/steamy-relationships-how-atmospheric-water-vapor-amplifies-earths-greenhouse-effect/ (Accessed 16 November 2025)
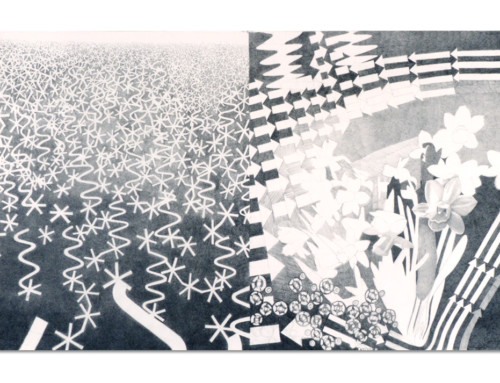
Using a network of connective lines and arrows to indicate the movement of energy, my drawing begins to simulate this incredibly complex dynamic. Water vapor, represented by empty white cells, are freely dispersed on the left side of the drawing as they come together in cloud like shapes towards the right. Oxygen molecules are represented by white dots, Nitrogen by grey squares, and carbon on the right side is a dark grey target which sits atop a water vapor cloud. The medium sized white circles represent water in a foreground plane connected by a spidery network of threads indicating potential energy pathways for radiative cooling. The interconnected nature of these elements in the grid just begins to hint at the entropy which the system is headed towards.
While this drawing is my first experiment, where the mathematical relationship of quantities directs a visualization of invisible particles, and their relationship to one another, the greater sum could, on an extremely large sheet of paper, represent a fairly accurate model of how a single CO2 molecule influences neighboring particles. There are many directions I see for the development of new algorithms to aid in this method of drawing. Color and three dimensional forms may emerge as the project literally begins to take shape and define the relationships in more detail. Although, I believe further drawing is needed to continue building on the foundation of this abstract concept.